

Description
MATH225N Week 3: Lab Assignment.
Instructions
This week’s lab highlights using graphics, distributions, and tables to summarize and interpret data. Review the video below to gain an overview of this week’s lab assignment.
Part 1:
- Open the lab template from the Required Resources link above. (Fill in this template as you follow each of the steps below).
- Read the article supplied by your instructor. (You will find a graph OR table within the article, and then draw conclusions about the table or chart you chose and describe other ways that the same data could be presented).
- Fill in the name of the article on the template: “Review of [Name of Article].”
- State the Author on the template.
- Summarize the article in one paragraph.
Part 2:
- Step 1: Find a frequency table and/or a graph within the article and post a screenshot in your Word document.
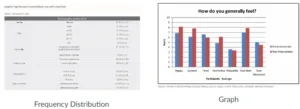
- Step 2: Answer the following questions about your table or graph.
-
- What type of study is used in the article (quantitative or qualitative)? Explain how you came to that conclusion.
- What type of graph or table did you choose for your lab (bar graph, histogram, stem & leaf plot, etc.)? What characteristics make it this type (you should bring in material that you learned in the course)?
- Describe the data displayed in your frequency distribution or graph (consider class size, class width, total frequency, list of frequencies, class consistency, explanatory variables, response variables, shapes of distributions, etc.)
- Draw a conclusion about the data from the graph or frequency distribution in the context of the article.
- How else might this data have been displayed? Discuss the pros and cons of 2 other presentation options, such as tables or different graphical displays. Why do you think those two other presentation options (i.e., tables or different graphs) were not used in this article?
- Explain how the alternate presentation options would be constructed.
- Give the full APA reference (with the correct capitalization of the title!) of the article you are using for this lab.
- Step 3: Be sure your name is on the Word document, save it, and then submit it under “Assignments” and “Week 3: Lab”.
SOLUTION:
MATH225N Week 3: Lab Assignment
Part 1
Review of Article
Article Title: Review of Prevalence of Diabetes in the United States, 2000–2020
Author: Johnson, L. R. (2021)
The article by Johnson (2021) explores trends in diabetes prevalence across different demographics in the United States over a twenty-year period. The research highlights how factors such as age, gender, and socioeconomic status influence diabetes rates. The article uses frequency tables and bar graphs to present statistical findings, making the information accessible and easy to interpret. Johnson emphasizes that diabetes prevalence has steadily increased in adults aged 45–64, while younger populations (18–29) remain less affected. The author concludes that identifying such demographic differences is essential for targeting public health interventions.…………………………………….Get a complete solution at $ 9.99

Reviews
There are no reviews yet.